Store brands expansion over the past twelve months includes significant growth in several large food and nonfood categories, according to Circana sales data for the 52 weeks ending May 17.
Six food categories with annual store brand sales of $500 million or more increased by double digits. The leader of the pack was Side Dishes/Refrigerated, which improved 23.3% and scored $1.8 billion in store brand sales for the period.
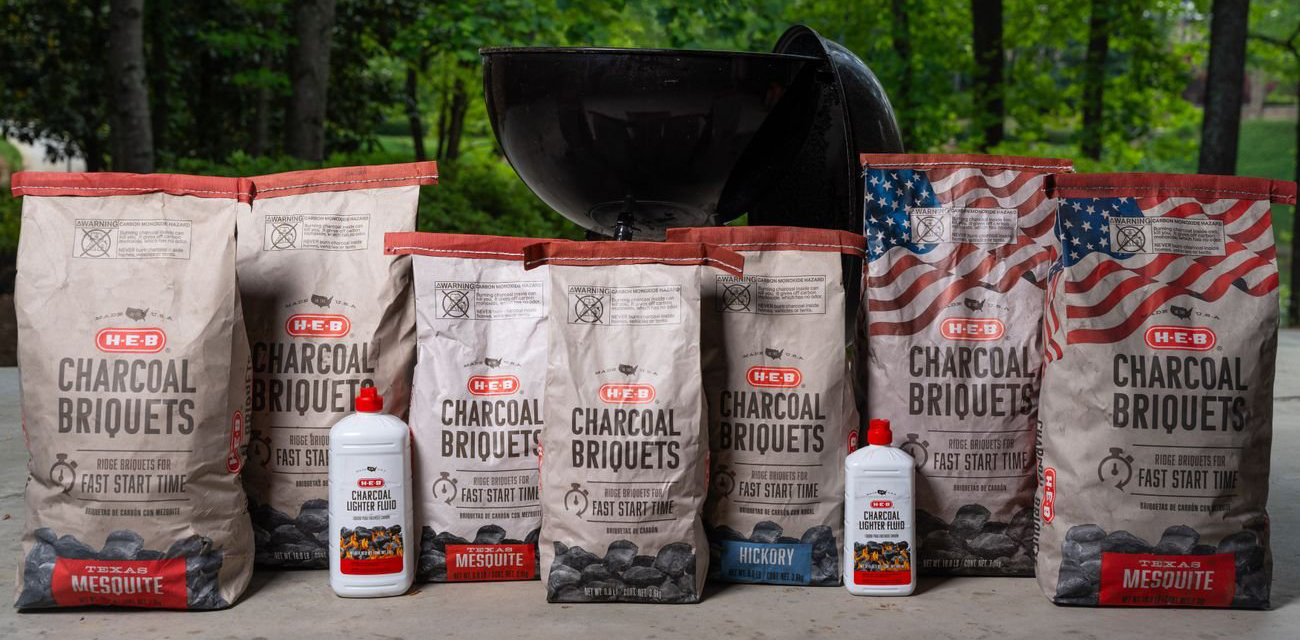
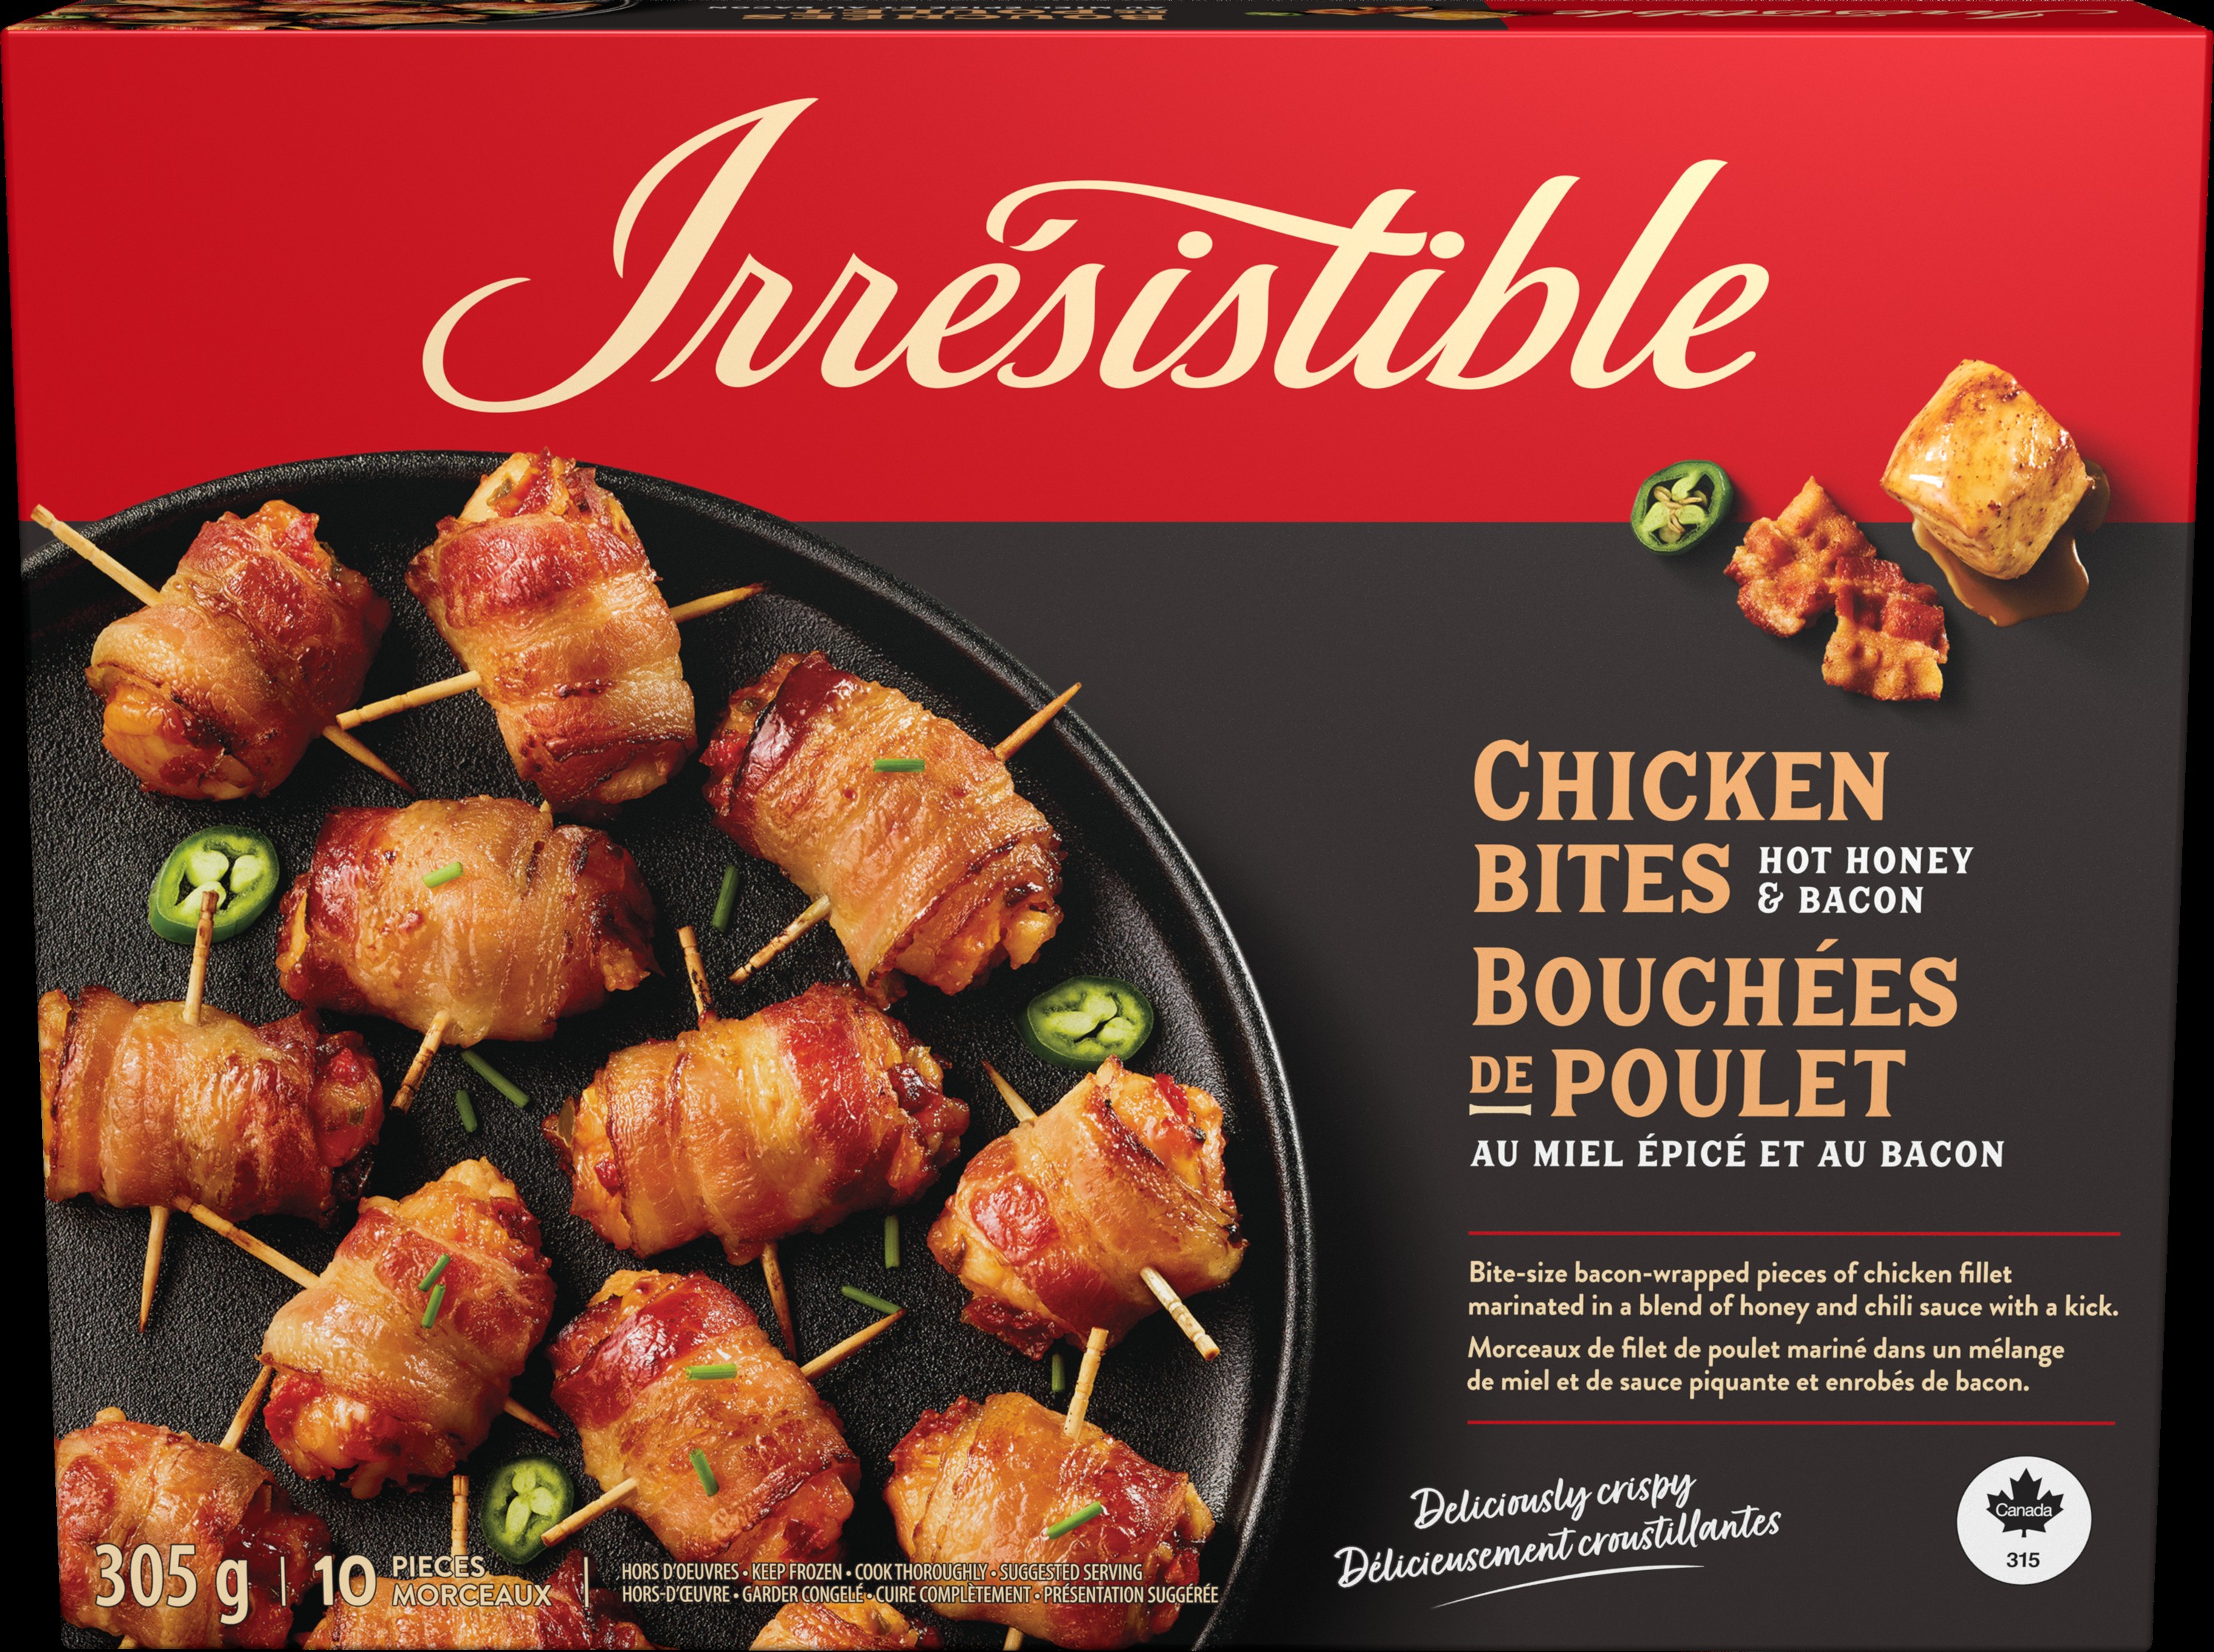
Next in line was Seafood/Refrigerated, up 20.6% ($570 million in sales); Coffee/Beverages, plus 16.4% ($2.6 billion in sales); Dried Meat Snacks/General Food, ahead 16.2% ($573 million in sales); Meat/Refrigerated, plus 14.1% ($6.7 billion in sales); and Chocolate Candy/General Food, which rose 13.9% ($930 million in sales).
At the same time, seven nonfood categories with annual store brand sales of $50 million or more also increased substantially over the same period. Mailing Supplies/General Merchandise was tops, gaining 144.5% and generating $161.3 million in store brand sales for the period, followed by Laundry Fabric Care.
Additives/Household Essentials, up 50.1% ($80.8 million in sales); Shoe Polish & Accessories/General Merchandise, ahead 30% ($49.6 million in sales); Fragrances-Women's/Beauty, which rose 26.5% ($117.3 million in sales); Cat Treats/Pet Care, plus 19.9% ($71.5 million in sales); Foil Pans/General Merchandise, up 18.9% ($365.5 million in sales); and Skin Care/Beauty, ahead by 16% ($328.6 million in sales).
Here are the Top 20 growing categories for food and nonfood over the past 52 weeks ending May 17, 2026.
Nonfood
| CATEGORY | PL DOLLAR SALES | CHANGE YA % |
|---|
| HAIR COLORING | $3,833,261 | 206.5% |
| PET TREATS | $6,466,272 | 184.0% |
| MAILING SUPPLIES | $161,246,300 | 144.5% |
| PET VEHICLE & TRAVEL | $1,999,021 | 125.1% |
| ELECTRIC SHAVER GROOMER | $3,840,468 | 68.6% |
| LAUNDRY FABRIC CARE ADDITIVES | $80,744,711 | 50.1% |
| HAIR SPRAY/SPRITZ | $5,336,733 | 36.8% |
| PAVEMENT DE-ICING | $14,928,842 | 34.0% |
| SHOE POLISH & ACCESSORIES | $49,639,998 | 30.0% |
| OTHER CLEANING TOOLS | $8,331,631 | 29.2% |
| PET SUPPLEMENTS | $31,186,567 | 27.8% |
| FRAGRANCES - WOMEN'S | $117,256,714 | 26.5% |
| SHOWERHEADS | $41,889,913 | 25.6% |
| OUTDOOR INSECT/RODENT CONTROL CHEM | $43,214,008 | 23.3% |
| AUTO APPEARANCE ACCESSORIES | $16,764,981 | 22.9% |
| DEODORANT | $2,198,203 | 21.8% |
| CAT TREATS | $71,478,650 | 19.9% |
| AUTOMOTIVE AIR FRESHENERS | $1,377,609 | 19.3% |
| FOIL PANS | $365,451,384 | 18.9% |
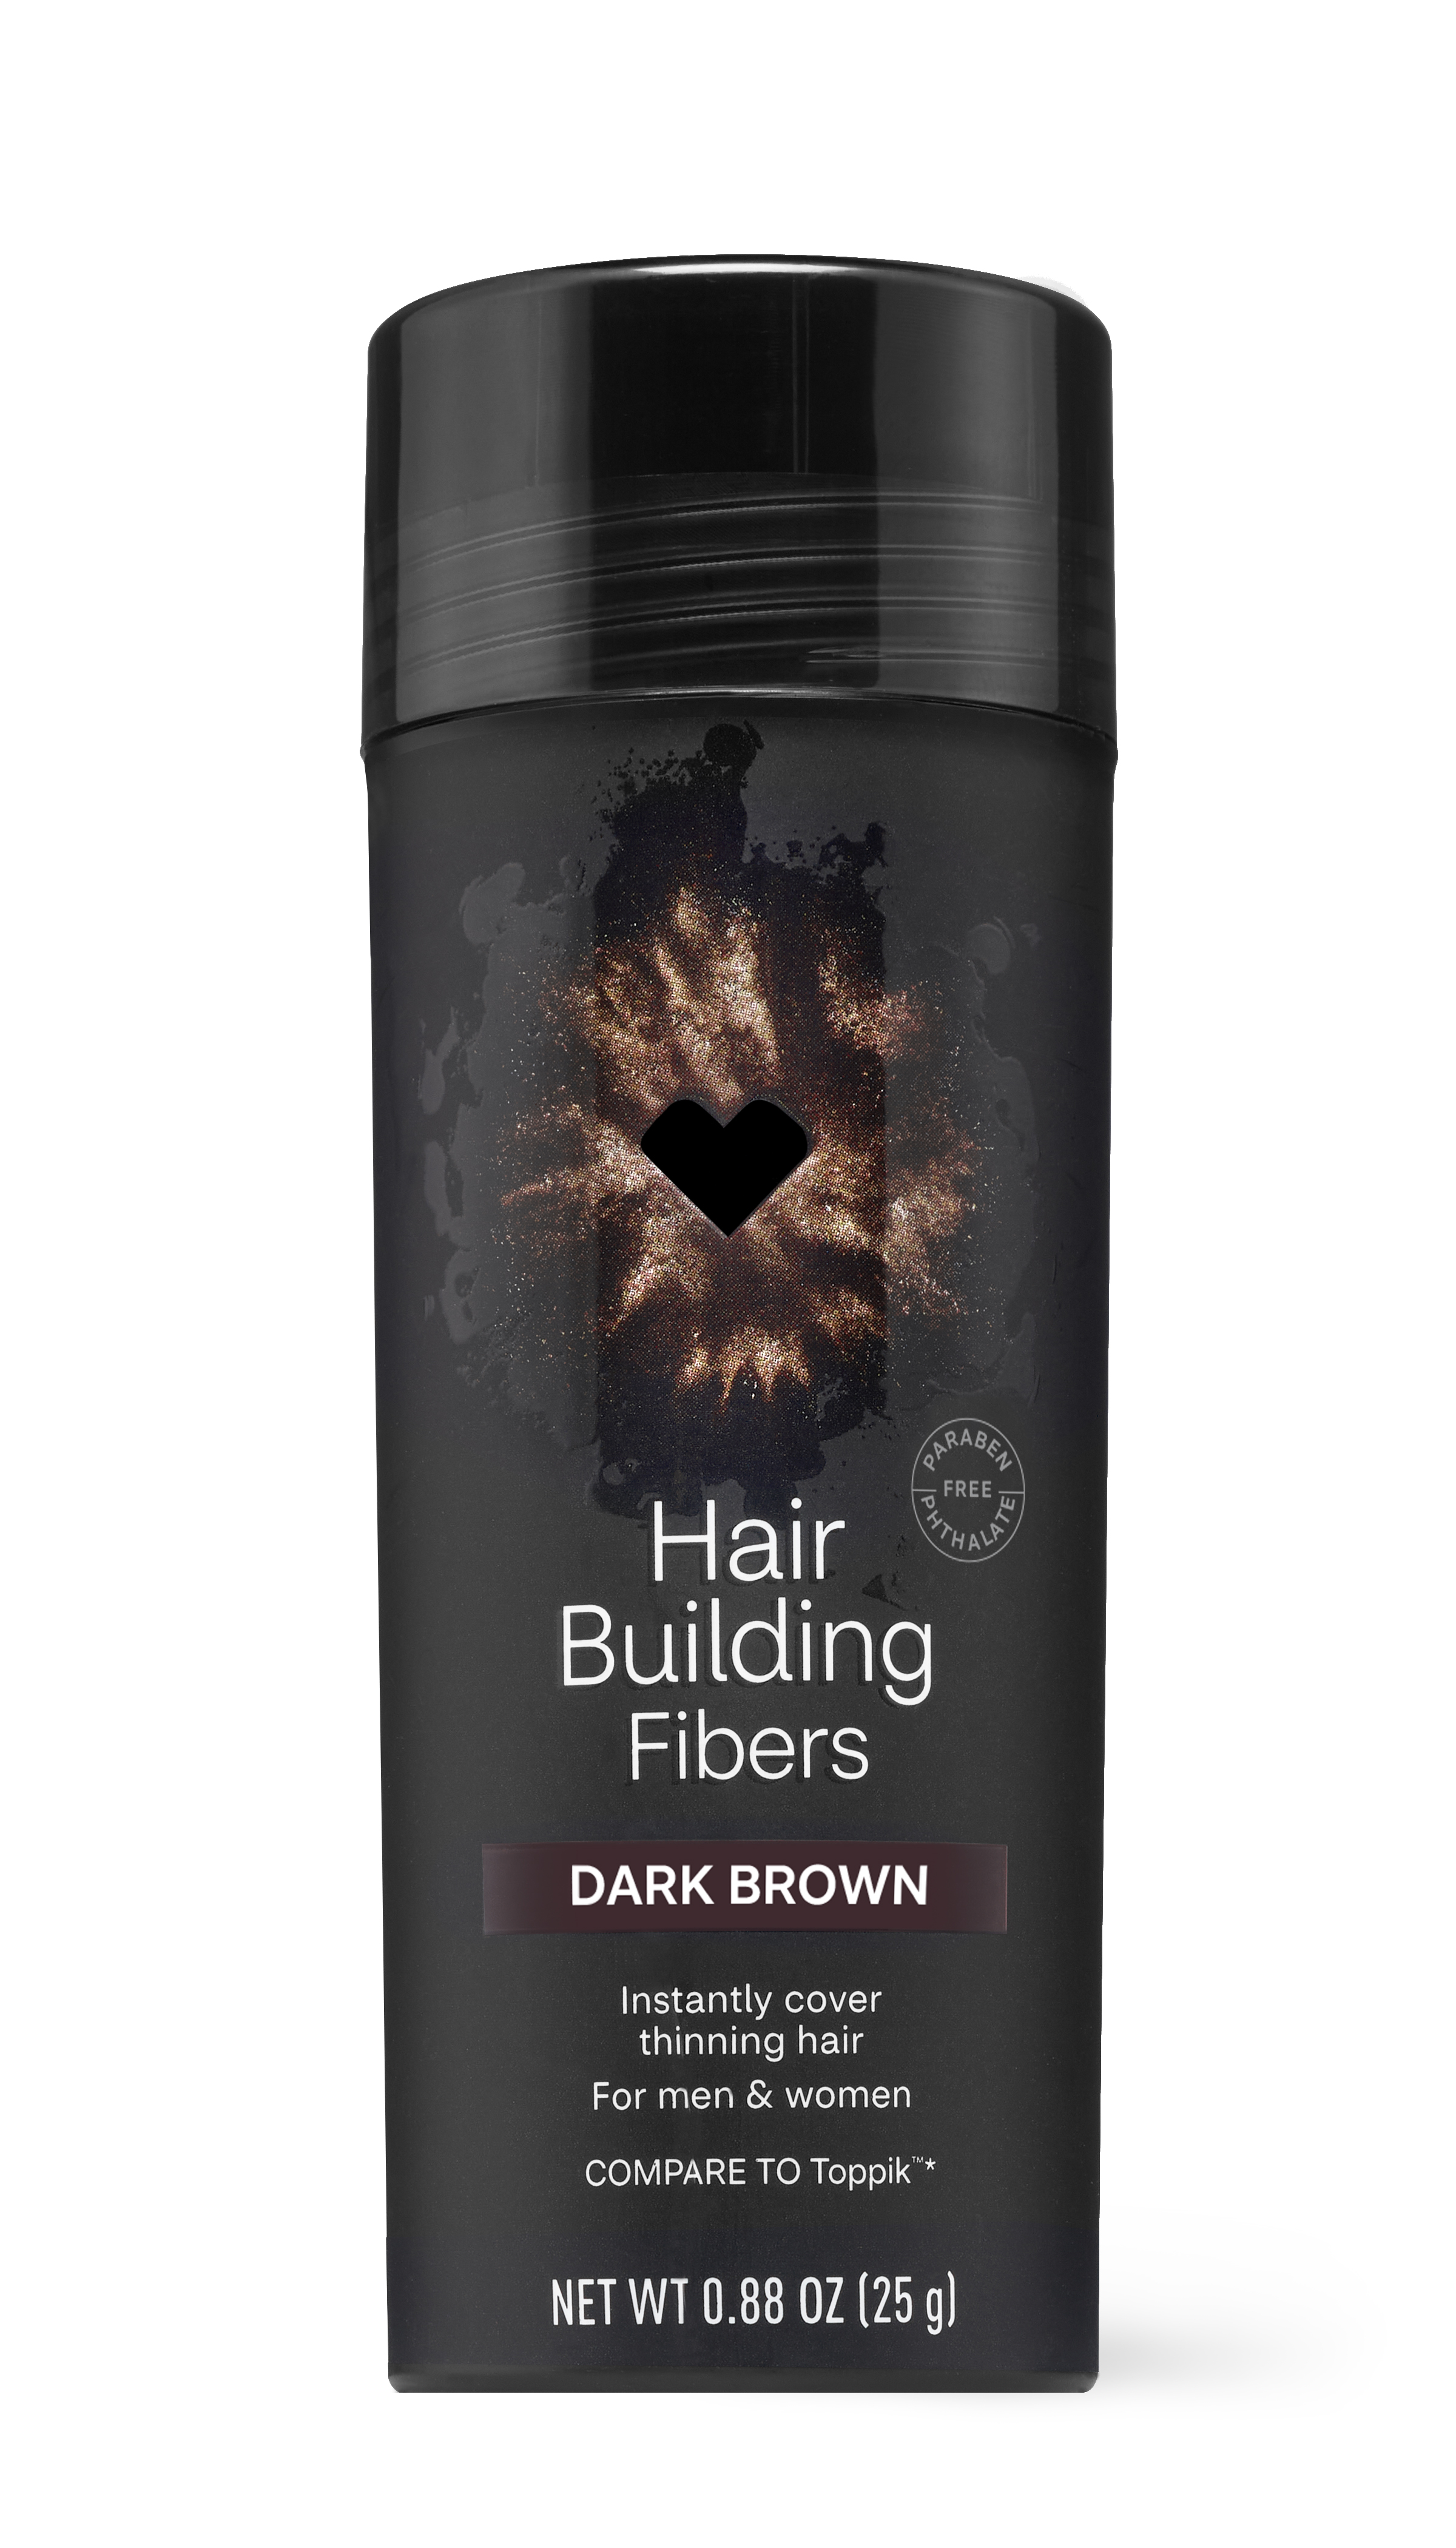
| SKINCARE | $328,619,446 | 16% |
Food
| CATEGORY | PL DOLLAR SALES | CHANGE YA % |
|---|
| BEER/ALE/ALCOHOLIC CIDER | $2,652,668 | 254.5% |
| GUM | $9,789,001 | 43.0% |
| CANNED JUICES – SS | $45,766,550 | 32.5% |
| OTHER SNACKS – FZ | $7,337,717 | 29.0% |
| ASEPTIC JUICES | $133,561,124 | 26.4% |
| BAKED GOODS – RFG | $415,999,893 | 25.0% |
| ALL OTHER MILK | $22,460,931 | 23.7% |
| SIDE DISHES – RFG | $1,791,704,457 | 23.3% |
| SEAFOOD – RFG | $569,591,177 | 20.6% |
| SIDES/OTHER – FZ | $135,230,073 | 20.4% |
| PASTA – RFG | $173,631,575 | 19.7% |
| WINE | $36,884,359 | 18.6% |
| COFFEE | $2,550,590,377 | 16.4% |
| DRIED MEAT SNACKS | $572,727,971 | 16.2% |
| OTHER BREAKFAST FOOD – SS | $379,974 | 15.2% |
| JUICES – FZ | $138,205,778 | 14.4% |
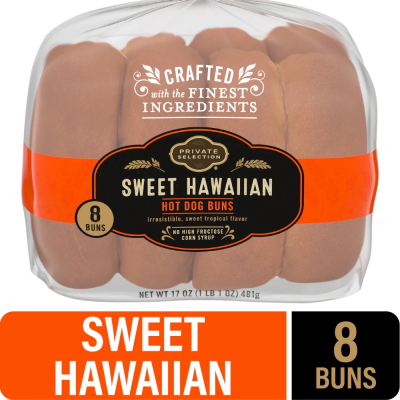
| FRANKFURTERS | $260,107,433 | 14.4% |
| DRY FRUIT SNACKS | $248,157,517 | 14.3% |
| MEAT – RFG | $6,732,543,683 | 14.1% |
| CHOCOLATE CANDY | $930,220,115 | 13.9% |